Spectral Clustering | Model
Dataset
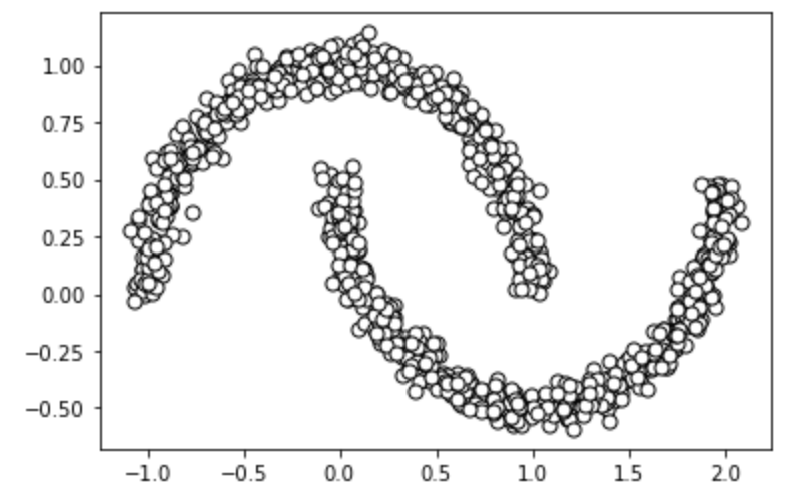
For this notebook, we will use a generated dataset in the shape of two intersecting half moons. We can generate and visualize the dataset below.
from sklearn.datasets import make_moons
X, y = make_moons(n_samples=1000, noise=0.05)
import matplotlib.pyplot as plt
# plot
plt.scatter(
X[:, 0], X[:, 1],
c='white', marker='o',
edgecolor='black', s=50
)
plt.show()

K-means
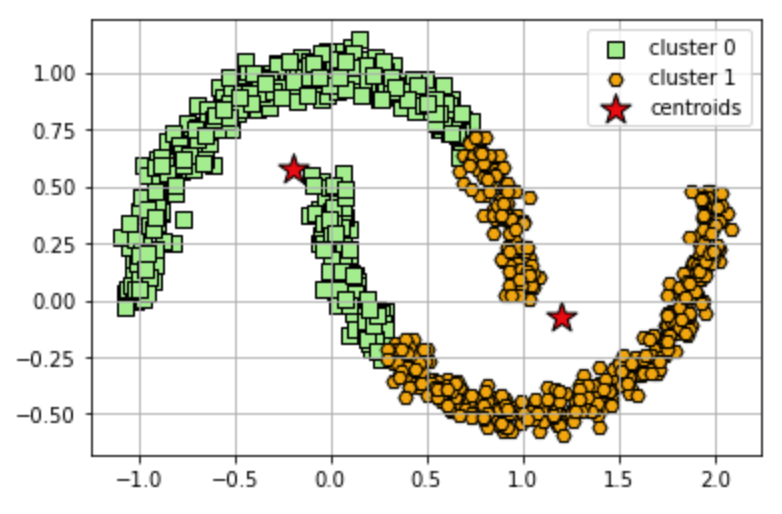
We saw in the previous notebook that K-Means works well for data sets that have a cluster structure that is spherical like the example data set used in that notebook. Now, let's take a look at a moon-shaped dataset. K-means cannot successfully cluster data in these configurations (even though visually we can see two clusters) because it uses a distance matrix to group points to a centroid. Below we will see what happens when we try to apply K-Means.
from sklearn.cluster import KMeans
clusters = 2
km = KMeans(
n_clusters=clusters, init='random',
n_init=16, max_iter=300,
tol=1e-04, random_state=0
)
y_km = km.fit_predict(X)
# plot the 3 clusters
colors = ['lightgreen', 'orange', 'lightblue', 'lightcoral', 'gold', 'plum', 'midnightblue', ' indigo', 'sandybrown']
markers = ['s', 'H', 'v', 'p', '^', 'o', 'X', 'd', 'P' ]
for i in range(clusters):
plt.scatter(
X[y_km == i, 0], X[y_km == i, 1],
s=50, c=colors[i],
marker=markers[i], edgecolor='black',
label='cluster ' + str(i)
)
# plot the centroids
plt.scatter(
km.cluster_centers_[:, 0], km.cluster_centers_[:, 1],
s=250, marker='*',
c='red', edgecolor='black',
label='centroids'
)
plt.legend(scatterpoints=1)
plt.grid()
plt.show()

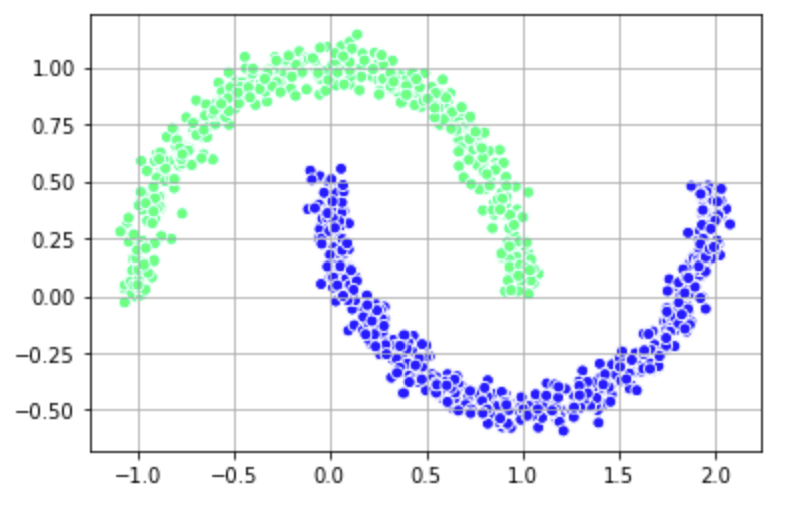
Since we know that k-means does not work, we need another clustering option. This is where spectral clustering comes in. For this example, we will use the generated dataset with the two intersecting moon shapes we just tried to cluster above.
Train a classifier using the SpectralClustering method and visualize it with the half moon dataset.
from sklearn.cluster import SpectralClustering
from sklearn.preprocessing import StandardScaler, normalize
from sklearn.decomposition import PCA
import pandas as pd
# Building the clustering model
spectral_model_rbf_2 = SpectralClustering(n_clusters = 2, affinity ='nearest_neighbors')
# Training the model and Storing the predicted cluster labels
labels_rbf_2 = spectral_model_rbf_2.fit_predict(X)
plt.scatter(X[:, 0], X[:, 1],
c = labels_rbf_2, edgecolor='white', cmap =plt.cm.winter)
plt.grid()
plt.show()
